Investing in individual stocks can be both exciting and intimidating, especially for new investors. Without understanding the key metrics that determine a good investment, a stock investor risks losing their money.
Investing in an S&P 500 index fund provides a more stable return over time. You simply bet on the prosperity of the top 500 companies in the United States. And as the companies in that index grow, your wealth also grows.
That’s why I recommend passive index investing to most people.
But investors who want the potential of much higher rewards can aim for individual stock picking instead — as long as you do this wisely.
Stock picking is a skill
There’s a high risk of losing money when you invest in individual stocks, as some may lose value and never recover.
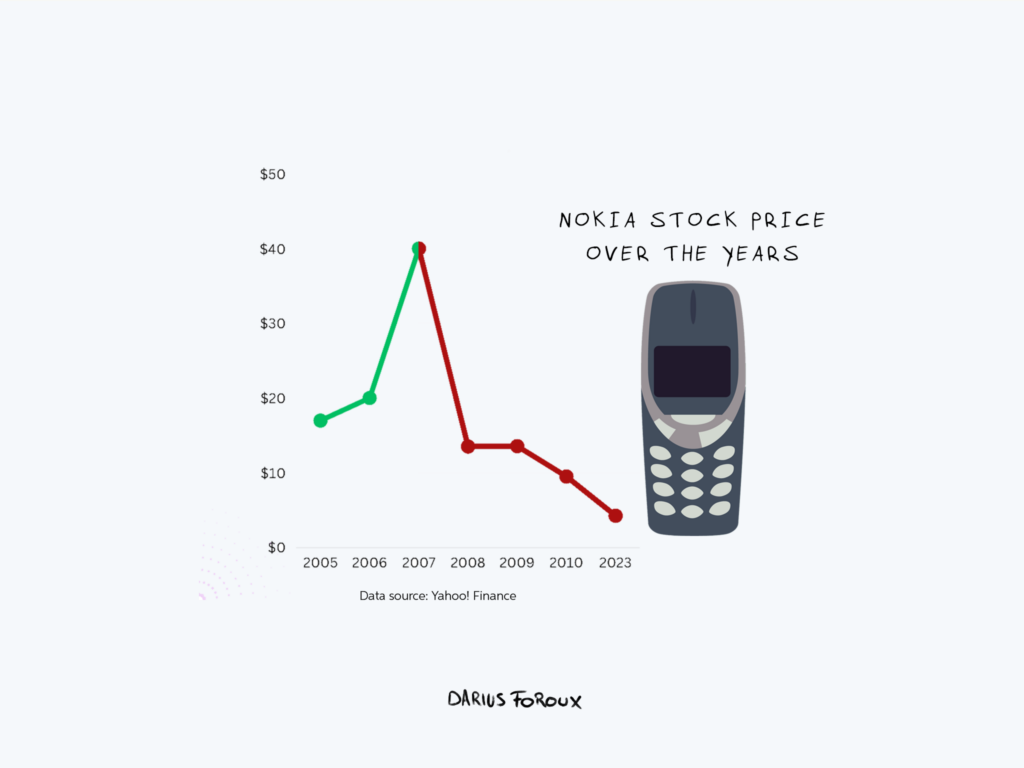
A good example is the Nokia Corporation (NOK). Nokia, a Finnish telecommunications company, was once the world’s largest vendor of mobile phones. I remember having the Nokia 3210 and 3310 back then. Everyone I knew loved those phones.
In 2007, Nokia’s stock price reached a peak of about $40 per share. However, with the rise of smartphones and increased competition from companies like Apple, Nokia’s market share declined significantly.1Source: The Street
Although the company still exists and has diversified its business, its stock price has never returned to its peak level. By the end of 2012, five years later, Nokia was trading at $2.93 per share. As of this writing, Nokia’s stock price is just a little over 4 bucks.2Source: Marketwatch
Imagine pouring your money on Nokia stock back in 2007, when people thought Nokia was the biggest superpower for smartphones. Even if you held on to the stock for 16 long years, you’d never recover your money.
So to increase your odds of not losing money, it’s important to be knowledgeable about the skill of investing. One part of that is knowing the basic metrics that tell you whether a company or stock is worth buying.
I’ll briefly cover metrics that are important to value investors but also to traders. In my experience, you’re best off when you keep short-term and long-term indicators in mind.
Remember: Valuing stocks is an art. There’s no single formula. Investing is not math. You can have the right approach to investing and still lose money.
With that said, these are the metrics I rely on the most when I buy individual stocks.
1. Earnings per Share (EPS)
EPS is a financial metric that shows a company’s profitability by dividing its net income by the total number of outstanding shares of common stock.
A higher EPS indicates the company is more profitable, while a lower EPS suggests less profitability.
Understanding EPS can assist you in making informed investment decisions.
2. Price-to-Earnings Ratio (P/E Ratio)
The P/E ratio is a metric that helps you determine if a stock’s price is reasonable compared to its earnings.
To calculate the P/E ratio, simply divide the stock’s market price by its earnings per share (EPS). The resulting number will give you an idea of how much you’re paying for each dollar of earnings generated by the company.
A lower P/E ratio may suggest that the stock is undervalued, while a higher P/E ratio could indicate that it’s overvalued.
3. Dividend Yield
This tells you how much annual dividend income you can expect to receive from a stock, expressed as a percentage of the stock’s current market price.
Higher dividend yields are generally more attractive to income-seeking investors. There are also ETFs that include a basket of high-dividend stocks.
4. Price-to-Sales Ratio (P/S Ratio)
The P/S shows you the amount investors are willing to pay for each dollar of a company’s sales. You can calculate it by dividing the company’s market capitalization by its total sales over a specific period (usually twelve months) or on a per-share basis by dividing the stock price by sales per share.
The P/S ratio goes by other names, such as sales multiple or revenue multiple.
As with all ratios, the P/S ratio is most useful when comparing companies within the same sector. A low ratio does not always mean it’s undervalued. And a high value also doesn’t mean it’s overvalued. The company might grow its sales exponentially. That’s why investors are willing to pay up a higher sales multiple now.
5. Return on Invested Capital (ROIC)
Imagine you’re lending money to a friend who promises to pay you back with interest. How effectively your friend can use that money to generate profit is essentially what ROIC means.
It measures how efficiently a company generates profit from its invested capital, including both equity and debt financing.
A higher ROIC indicates that a company is effectively using its capital to grow its business and create value for shareholders.
6. Gross Profit Margin
The gross profit margin helps you understand how much money a company is making after covering its costs. In the context of stocks, it represents the percentage of revenue that remains after accounting for the cost of goods sold (COGS).
A higher gross profit margin indicates that a company is more efficient at converting sales into profits. Higher profit margins are always better.
7. Moving Averages: 50-day, 150-day, and 200-day
Moving averages are used by traders to understand the direction of a stock’s price. By calculating the average closing price over a specific period, you get a clearer picture of the stock’s overall trend.
There are three commonly used moving averages:
- 50-day moving average: This shorter-term moving average reflects the average closing price over the past 50 trading days. It’s useful for identifying short-term trends and potential entry or exit points for trades.
- 150-day moving average: A more intermediate-term indicator, the 150-day moving average provides a broader view of a stock’s price movement. It can help you identify medium-term trends and support or resistance levels.
- 200-day moving average: The 200-day moving average is considered a longer-term indicator. It’s used to gauge the overall direction of a stock. When a stock’s price is above its 200-day moving average, it’s generally considered to be in an uptrend, while a price below the 200-day moving average implies a downtrend.
I generally don’t go against trends when I buy stocks. That’s because you might be right about the stock but wrong in its short-term direction. When I see a quick loss on my trades, I sell because I don’t want to lose more than 10% on each trade.
Since I cap my losses, I can keep trading stocks. Even when I trade, I also look at all the other metrics I shared in this article. I always stay away from bad businesses, no matter how attractive their trends are.
Don’t put your money on the line unless you’ve mastered investing
Remember, investing in individual stocks comes with risks. By familiarizing yourself with these key metrics, you can make yourself an educated investor.
That’s the key. Don’t buy stocks unless you feel confident about your knowledge of long-term and short-term investing. It’s important you have a good understanding of what you’re doing.